

[mwm-aal-display]
Introduction
MassiveLag is a revolutionary Lag and TPS diagnostics plugin. Its specialty is detecting why you have performance issues. It will tell you exactly where those lag spikes and TPS drops are coming from.
Performance issues are common in Minecraft and are usually caused by slow server plugins. To fix performance issues, we must figure out which plugin is slow so we can uninstall it, or better, figure out exactly what source code within the plugin is slow so we can ask the developer to fix it.
MassiveLag helps you do just that. This plugin tells you where the slowness in plugins is, all the way down to specific lines in source code.
MassiveLag also ships with commands to check server TPS history, ping for players, specific command measurement and much more.
We also included fixes to some common performance issues, such as redstone and inefficient tile entity list removal.
Compatible Minecraft Versions
1.11.x | 1.10.x | 1.9.x | 1.8.x | 1.7.10
CraftBukkit, Spigot and PaperSpigot are compatible.
Cauldron and Thermos are NOT compatible.
Commands
- /ml tps [server/all=you] TPS history chart with one bar per second.
- /ml ping [player=you] See your server latency in milliseconds.
- /ml echo [message=<h>Pong!] Old-school ping test just says pong back.
- /ml spike [millis=1000]
Cause a TPS based lag spike! - /ml m,monitor [millis=show]
Set the lag spike monitor threshold.
- /ml t,timings l,list [page=1] [search=]
List timings with most CPU consuming ones first. - /ml t,timings s,show <id> [page=1]
Show detailed information for a certain timing. - /ml t,timings r,reset
Reset timing statistics. - /ml t,timings e,enabled [yes/no/show=show]
Check and set if timings are enabled.
- /ml c,command m,measure <command>
Measure time and hotspots within a command. - /ml c,command r,repeat <times> <command>
Run the same command multiple times.
- /ml v,version
Display plugin version and information
Terminology
To understand this plugin fully we suggest you familiarize yourself with this terminology:
Ticks: A Minecraft server simulates the game world in small steps. These steps are called ticks.
TPS (Ticks per Second): The server aims to complete 20 ticks per second. If the server has too much work to do, it won’t have time to complete 20 ticks, causing the TPS to decrease. The TPS is thus a value between 0 and 20.
MPT (Milliseconds per Tick): There are 1000 milliseconds in a second. If we are to have 20 TPS, the maximum MPT is 50 milliseconds. Simply put each tick has a quota of 50 milliseconds.
Ping: The time in milliseconds for data to be sent between player and server. It measures the responsiveness of the internet connection. The lower ping the better.
FPS (Frames per Second): How fluently the player client renders screen graphics. Low FPS is usually caused by having a weak graphics card or high graphics settings.
Lag: Uttered by players when they experience high ping, low TPS or low FPS.
Lag Spike: When the entire game appears to freeze for a short moment, usually caused by a certain server tick vastly overstepping the 50 millisecond quota. The server is busy working with something too long.
Stack Trace: An explanation of what line in the source code is getting executed and how we got there.
Stack Tree: A combination of multiple stack traces. It explains what lines in the source code are the slowest.
Basic Commands
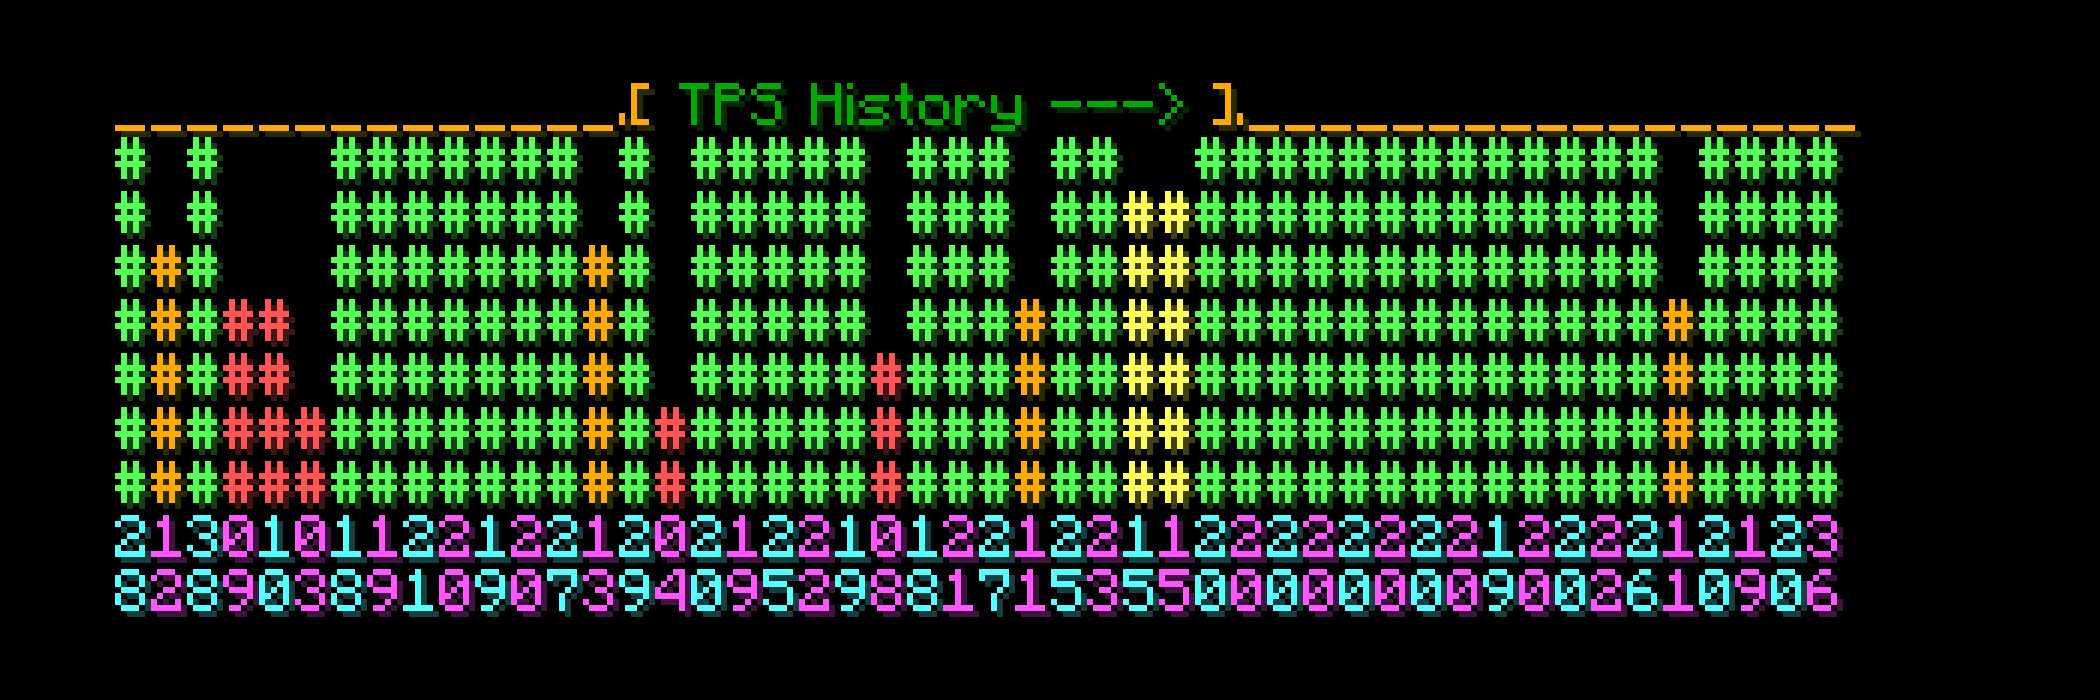
/ml tps [server/all=you]
Displays TPS for the last 48 seconds, at a rate of one column per second with the most recent second to the left.
/ml ping [player=you]

What is your ping, exactly?
/ml echo [message=<h>Pong!]

Simply sends a message to you. The fine old-school way to check ping.
/ml spike [millis=1000]

Cause a lag spike. Useful for getting to know what a lag spike feels like or to test the plugin features.
Timing Command
The timing system measures the performance of plugin commands, events and tasks.
/ml timing list
[page=1] [search=]
[/fusion_builder_row_inner]
Use /ml t l to show the first page.
Use /ml t l 2 to show the second page etc.
The 6 columns mean the following:
- White – The id of the timing to be used with /ml t s <id>.
- Red – The CPU use measured in percent.
- Green – The amount of stack tree samples gathered.
- Pink – Name of the plugin.
- Yellow – Timing category. Command, Event or Task.
- Aqua – Timing action. What Command, Event or Task exactly?
As a rule of thumb, anything below 0.5% is probably not a problem. Anything above 1% is taking too long if you want good TPS. In this case we have identified MassiveMoney as the #1 lag cause. It would be a good idea to take a look at MassiveVanilla and MassiveTraits as well.
/ml timing show <id>
[page=1]
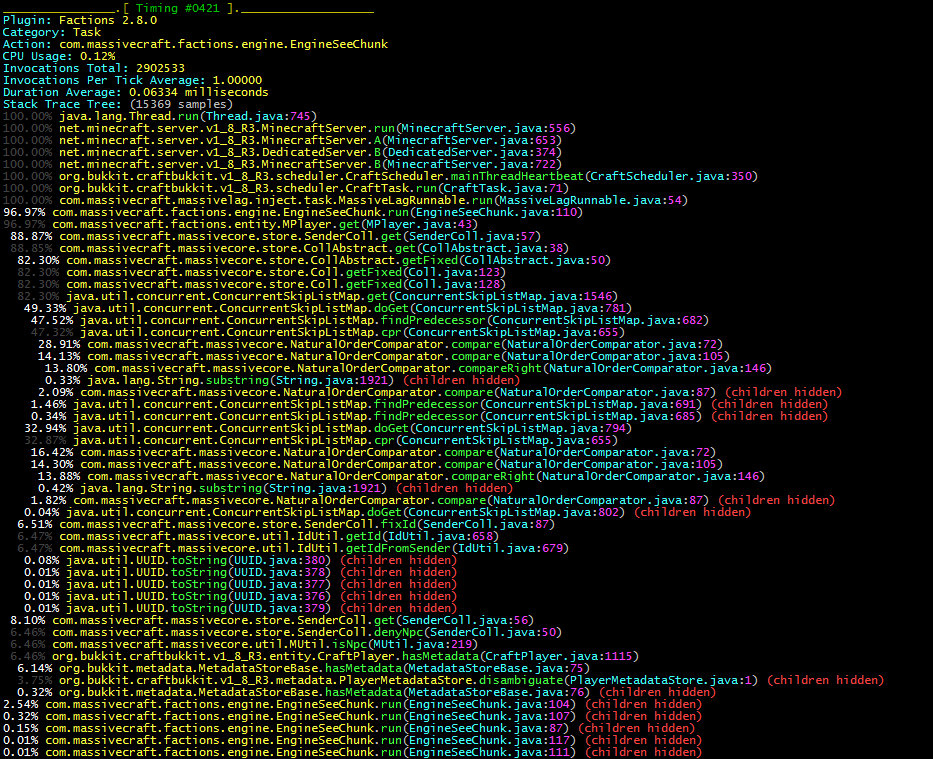
Use this command to take a closer look at a timing. For example, use /ml t s 421 to take a look at that Factions task.
Invocations Total
This is the total amount of times the task was run since server start or manual timings reset.
Invocations Per Tick Average
The average amount of times per tick the task has run since server start or manual timings reset. In this example the task seems to run once per tick.
Duration Average
The average duration the task takes to complete. In this case: 0.06334 milliseconds. Remember we have a total of 50 milliseconds per tick available if we want 20 TPS.
Stack Tree
This is where we see what actually goes on during those 0.06334 milliseconds. In this example the stack tree is based on 15369 samples/stacktraces.
When trying to interpret a stack tree, it helps to have some experience with coding plugins. In this example, 96.97% of the time is spent getting database information from players. Of those, 82.30% is spent getting the database object from the player ID which takes a lot of time since we are looking in a concurrent sorted map. We can also see that 8.10% is spent figuring out if the player is actually an NPC.
Optimizing this is not really required since it only takes 0.12% of total CPU. But if we wanted to, one solution would be to stop using a sorted map and start using one that isn’t sorted in source code.
Monitor Command
/ml monitor
[millis=show]
[/fusion_builder_row_inner]
Timings do not properly detect lag spikes which occur very seldom. What if a plugin locks the server for 3 seconds but only does so once a day? That is a serious lag spike that will piss players off, even if it happens just once.
This is where the massive lag monitor becomes useful. It looks for lag spikes and outputs a report immediately when one is found. Type /ml m 500 to report when a server tick takes longer than 500 milliseconds to complete. Type /ml m 0 to turn off.
In this example the server tick took 795 milliseconds to complete. That is waaaaay over the 50 milliseconds we want to stay within for that smooth 20 TPS.
From the stack tree it seems this is mostly Minecraft itself being slow. Since Minecraft is obfuscated, it’s hard to see what is going on. By reading through decompiled source, I could, for example, figure out that 18.18% (org.bukkit.craftbukkit.v1_8_R3.util.LongHashSet.contains) was spent checking if a chunk is actually being unloaded before proceeding to update it with plant growth, ice forming, etc.
We can also see that 40.00% is spent ticking tile entities such as Hoppers, Brewing Stands and Chests. There could be plugins behind this, but we can’t see because children are hidden. To see more, we should reconfigure MassiveLag to show more children (documented further down).
Command Commands
We also provide commands to measure performance of single specific command executions.
/ml command measure <command>
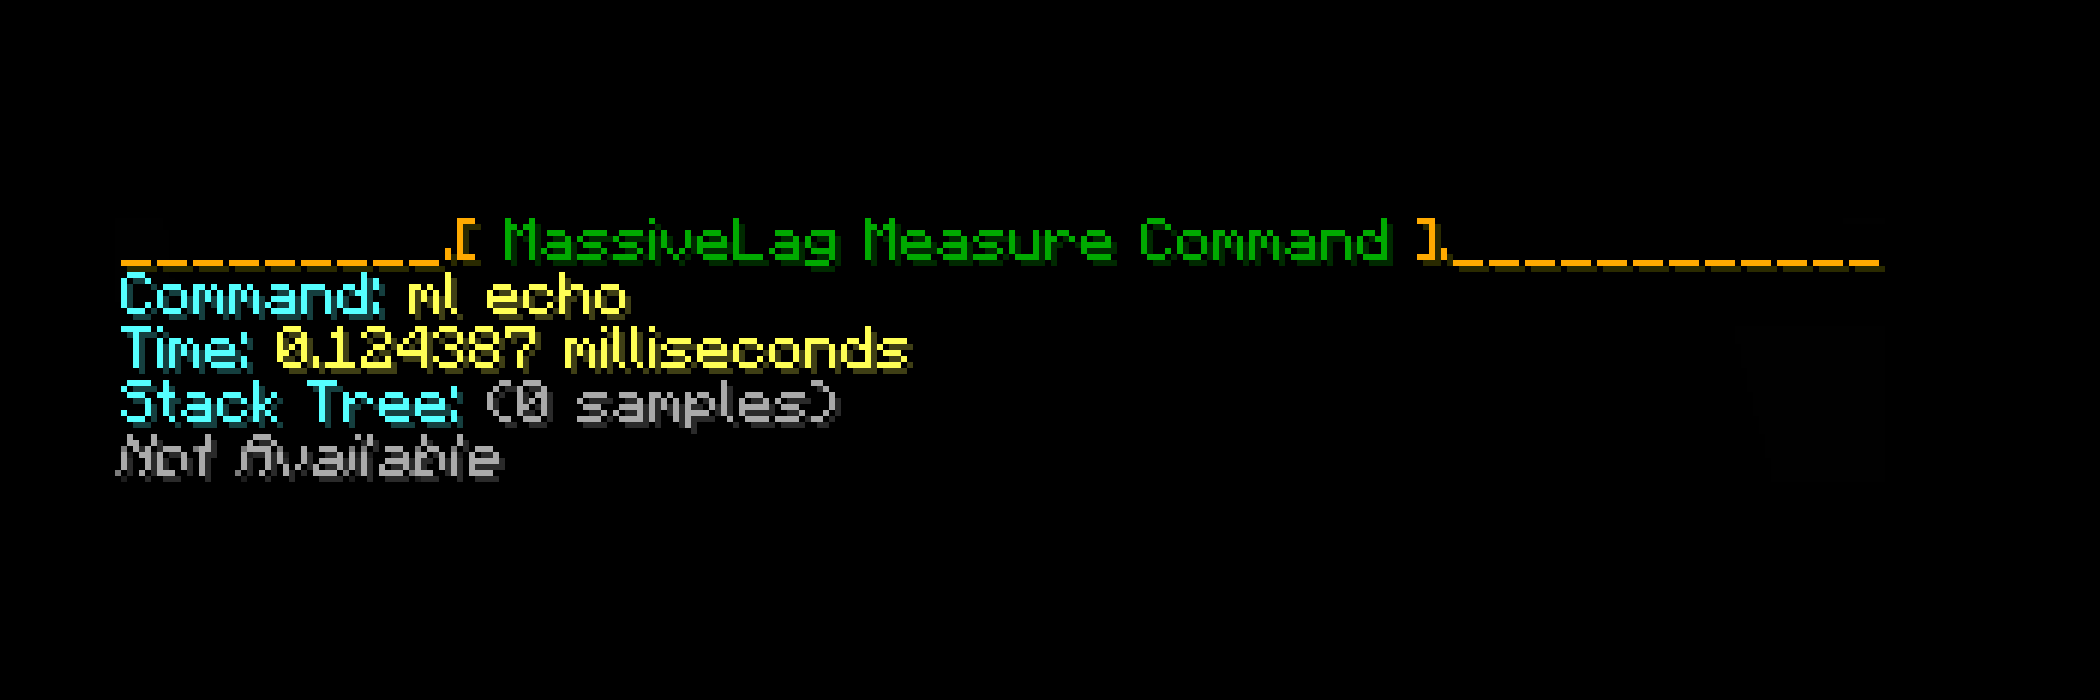
Use this command to measure the performance of that specific command execution.
For example /ml c m /ml echo would measure the time to execute /ml echo and could look like this.
/ml command repeat <times> <command>

Use this command to repeat a specific command multiple times.
For example /ml c r 3 /ml echo could look like this.
Combined!
As you can see above, the measure command failed to sample a Stack Tree because it only took 0.124387 milliseconds to run. We can, however, combine these two commands to get a result.
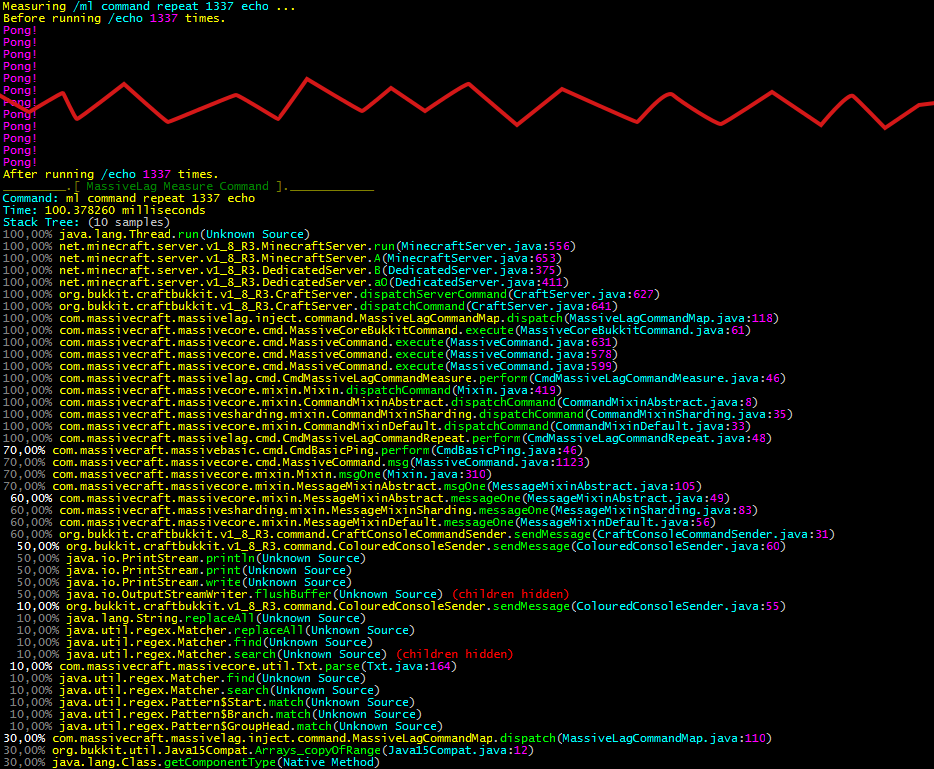
For example /ml c m /ml c r 1337 /ml echo could look like this.
Whatever that means, I leave to you to figure out as a homework task!
Redstone Limiter
Excessive redstone circuitry can impact server TPS. For that reason MassiveLag has a redstone limiter built in.
If there are too many redstone power changes per second the redstone will break. The solution for players is simple though: Set your redstone repeaters to work slower!
NOTE: This feature must be enabled in the plugin configuration.
Performance Fixes
If we find performance issues not yet fixed in Spigot/Craftbukkit, we try to patch them as well as we can. Currently there is one such fix present in MassiveLag.
Tile Entity List
Description:
Fixes a lag spike when chunks with many tile entities unload. An example is the last player who logged out near a giant chest storage facility. Inefficient removal of those tile entities would cause a lag spike. This fix replaces the tile entity lists with modified versions for faster removal.
Side Effects:
None whatsoever. Should be fixed in CraftBukkit.